XAU/USD GOLD Weekly Elliott wave analysis :
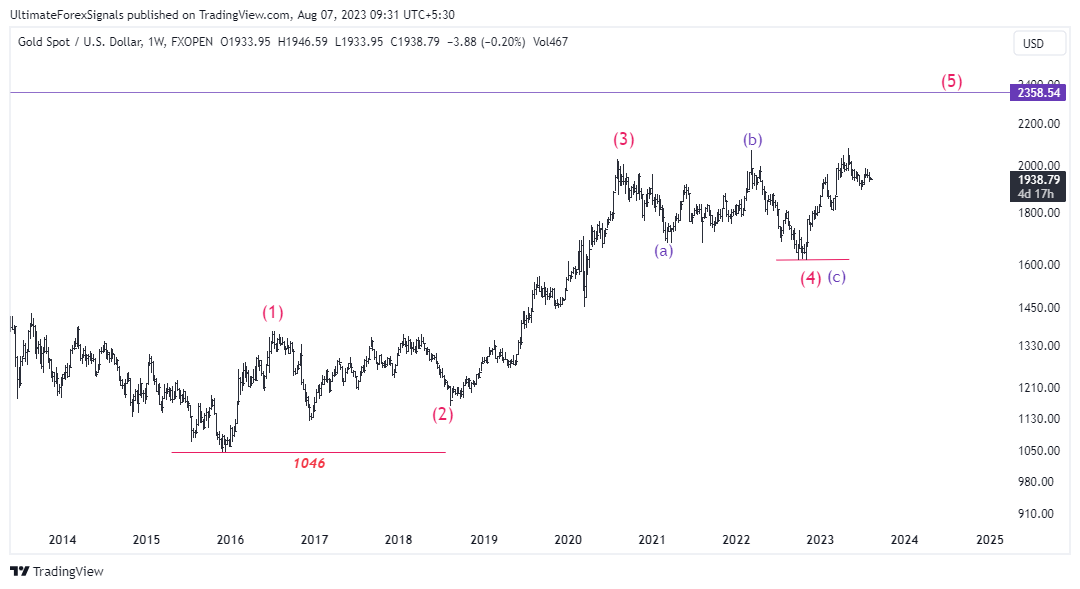
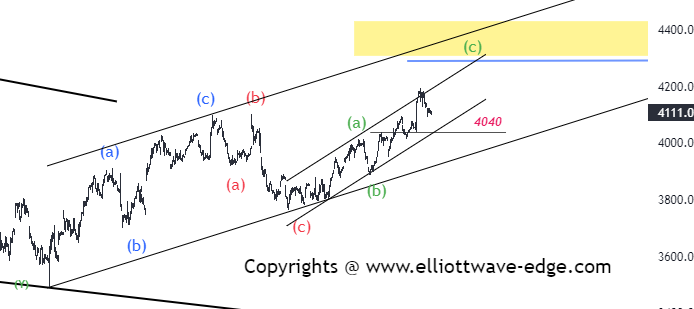
Gold Elliott wave analysis on a weekly chart started near the price of $1046. we can see five impulse sub-waves inside the 1st wave.
Wave 2 unfolded as an ABC flat correction. Here wave 2 is a Deep correction closed at $1166
Wave 3 as usual easily visible on the chart as its personality. It is less time-consuming and fast.3rd wave finished at $2033
Wave 4 is shown as abc correction finished at $1615. we can see a bull rally from $1615 which is the "X" wave of the 4th wave or new 5th wave impulse. This impulse wave high is $2081
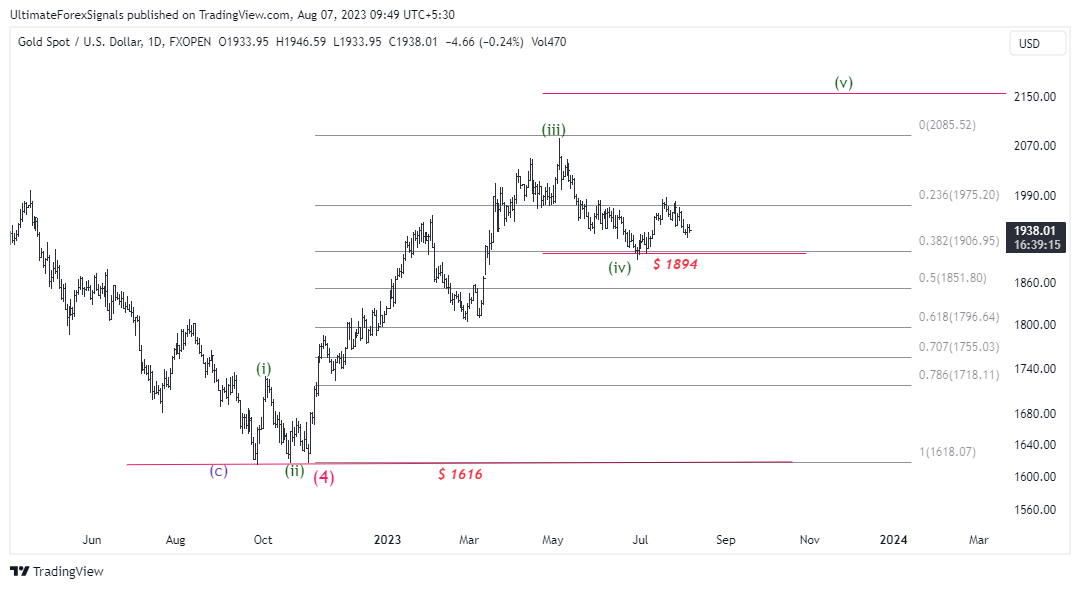
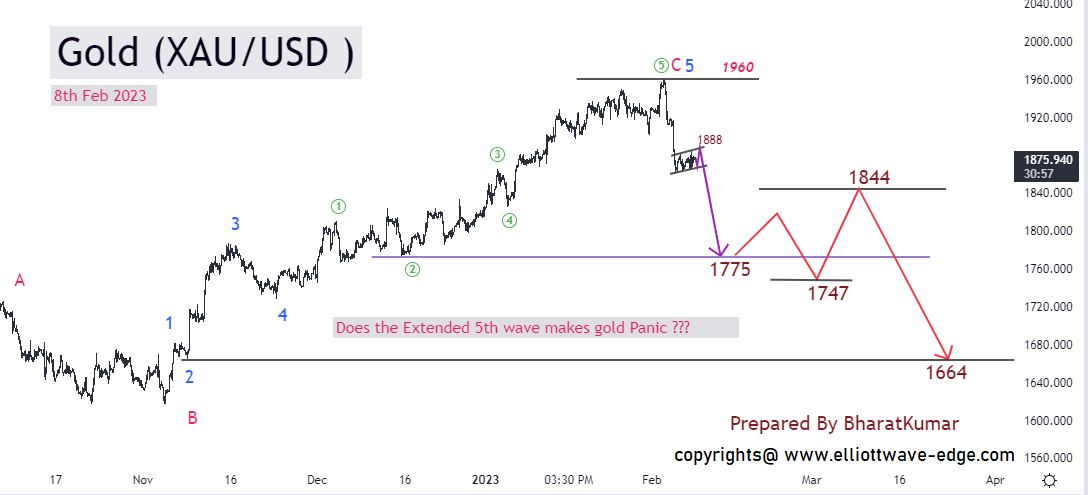
Let's go to the Daily Chart for a detailed analysis of the X wave or 5th wave.
Five Sub-waves counting from $1616. I have labeled high $2081 as (III)rd wave. See the personality of this wave is a big candle and Gap . which gives me confidence of 3rd wave.
Now. either we are is Vth wave or complex correction of IVth wave.



.png)


