S&P 500 ROAD-MAP Elliott Wave Analysis
Starting from the Year 1877
Contents:
1. 1st Wave (Y 1877 – 1929)
2. 2nd Wave (Y 1929 – 1932)
3. 3rd Wave
(Y 1932 – Under Progress.
4. Forecast of Sub-Wave 4th
S&P500 Index
Today
is 31st Jan 2023 and I am counting the waves of
the S&P500 Index. Let’s start the journey.
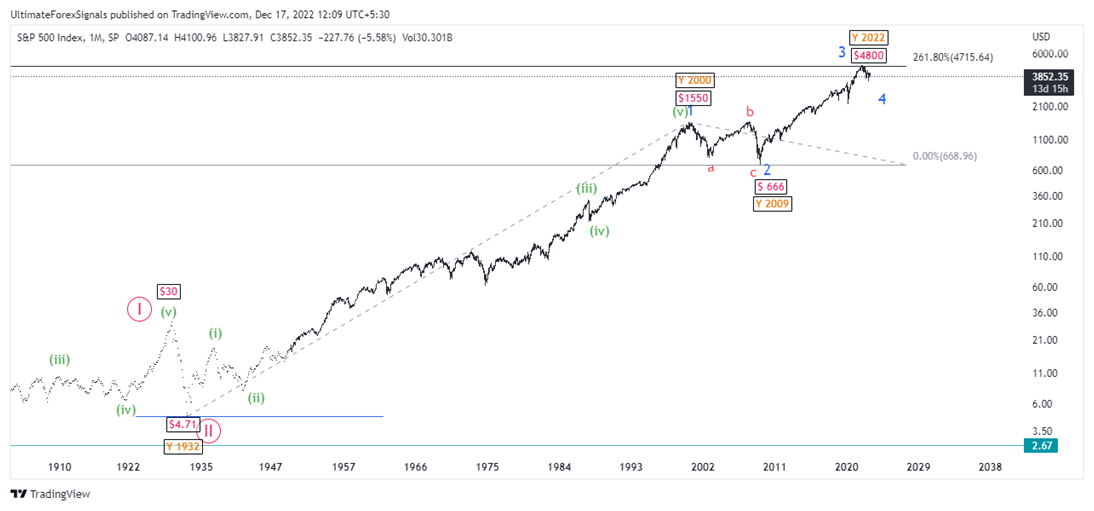
Ist
wave: Started from a Significant Low of $2.66 in Y 1877.
We can see five
sub-waves in green color and End at $30 in Y 1929 Around
52 Years have taken to develop the 1st wave.
II Wave : It is Y1929 to $1932 and Price $30 to $4.71 II wave was deep and sharp, with around 94% retracement of 1st wave and
only 3 years taken to complete. You can imagine which type of panic was created
in 1929-1932.
III Wave: It is $4.71 to continue...and Y 1932 to ??? Is
it 100 Years Cycle?
Sub-wave
1: Y 1932 to Y 2000
& Price $4.71 to $1550 We can see five green color mini sub-waves inside
the 1st sub-wave. A total of 68 years have taken to complete the 1st
sub-wave.
Sub-wave
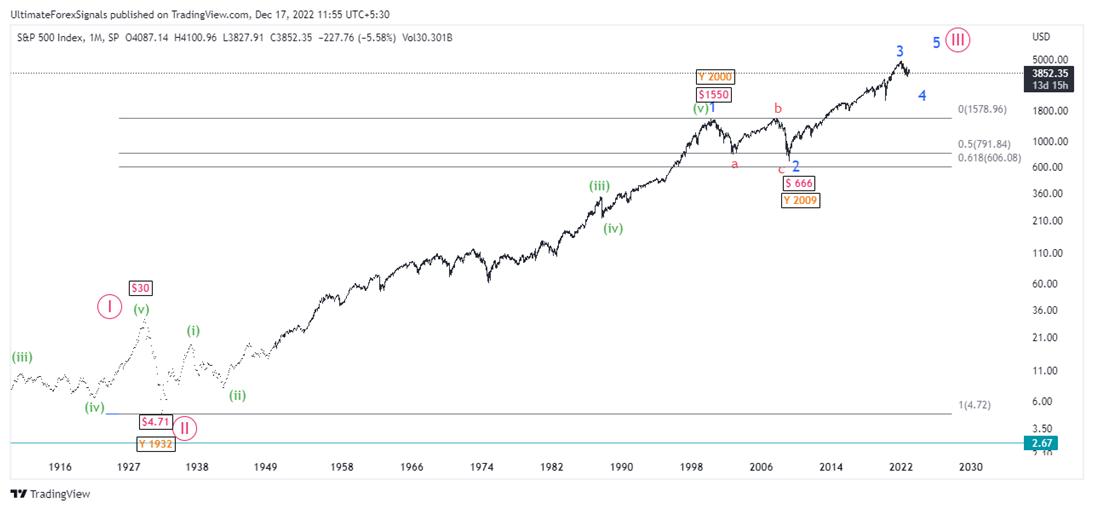
2: Y 2000 to Y 2009 (
Total 9 Years) Price $1550 to $666It
has shown flat correction as abc in which “b” wave tends to go up to the
start of “a” wave.
We
can see in chart 2nd sub-wave correction exactly ends between
Fibonacci 50% to 61.8%
As
per the rules of alternation 2nd sub-wave was simple and deep, we
may see 4th sub-wave as complex and shallow. This is a very
important thing to forecast the 4th sub-wave. We will discuss this
later when we will analyze 4th sub-wave.
Sub-wave
3: Y 2009 to Y 2022 (
Total 13 Years) Price $666 to $4800 As
usual 3rd wave personality is easily identified on
the chart in any degree. Here extended Sub-wave 3 is exactly 261.8%
Fibonacci ratio of 1st sub-wave.
 As
usual 3rd wave personality is easily identified on
the chart in any degree. Here extended Sub-wave 3 is exactly 261.8%
Fibonacci ratio of 1st sub-wave.
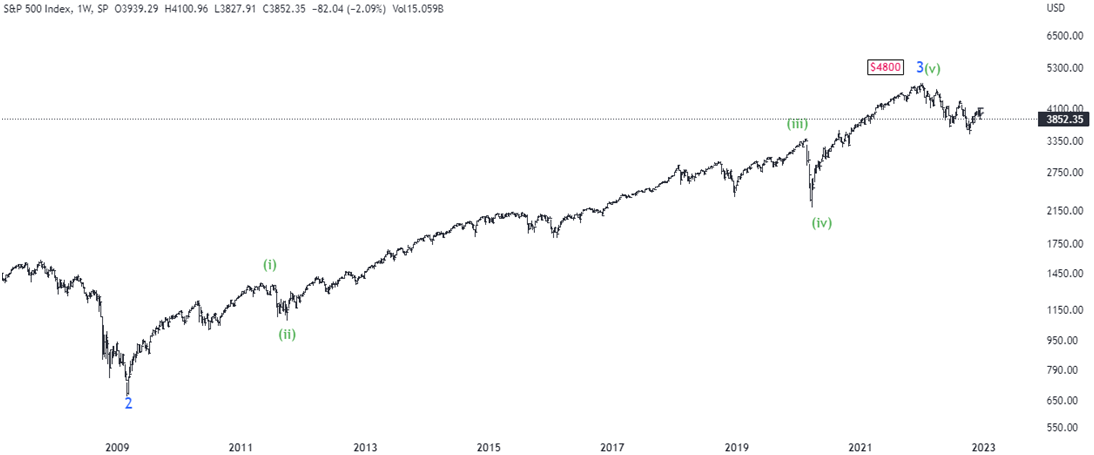
  Inside
Sub-wave 3, Mini sub waves as mentioned in green color also dance to Elliott
tunes.Sub-wave 4: Y 2022 to Under Progress & Price $4800 to .... ???
Inside
Sub-wave 3, Mini sub waves as mentioned in green color also dance to Elliott
tunes.Sub-wave 4: Y 2022 to Under Progress & Price $4800 to .... ???As Human beings, we love to predict the future
& Trading is a game where everyone wants to try their luck but few of them
succeed.
Why do they fail? The answer is none of them have a broad view of
Price sentiment. You should have one complete Road map for Entry &
Exit.
Let’s forecast Sub-wave 4,
Earlier we discussed the rules of an alternation. As 2nd Subwave
was flat and deep so 4th subwave may be shallow and Sharp.
WXY Double Zig-Zag Sharp Correction is unfolding and we know
it may be shallow. So we have a clue that we are in sharp and shallow
correction.
What do you mean by shallow correction ?? hmm right question.
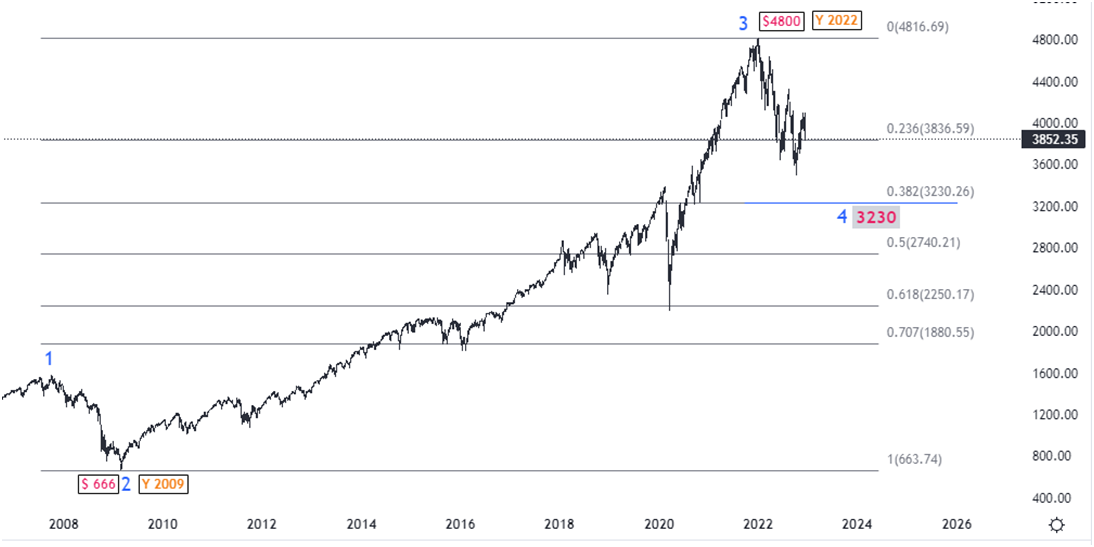
Most of the time Shallow correction near Fibonacci 38.2% of the Prior wave.
Here 4th wave maybe 38.2% (Prior to the 3rd wave).
Let’s check the level. So
we have one level where the end of Sub-wave 4th correction is
$3230Let’s
double-check with the inside of the Sub-wave 4th pattern.
 WXY pattern is showing on chart.
From 3478 new impulse or X wave is begun.
If "X" wave then S&P500 may face resistance between 4300-4400 and one more down leg may appear in 2023.If new impulse then it will break the 4300-4400 and we may see new High.
Wait and watch for the next dance step of S&P500 ....
Thank You ...
 So
we have one level where the end of Sub-wave 4th correction is
$3230Let’s
double-check with the inside of the Sub-wave 4th pattern.
 WXY pattern is showing on chart.


No comments:
Post a Comment