Dollar Index (DXY) Elliott Wave :
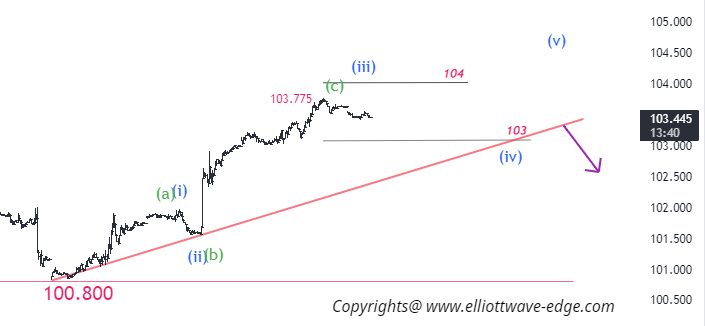
On a 15min time frame of DXY, from 100.800 DXY is in a correction of a prior downtrend.
let's see the 15 min chart,
let's see the 15 min chart,
103.775 to 104 where may 3rd wave or c wave end. If the price holds near the trendline around 103 then we may see again upward rally as the 5th wave.
Below trendline downtrend may see.
Gold Elliott wave Analysis:
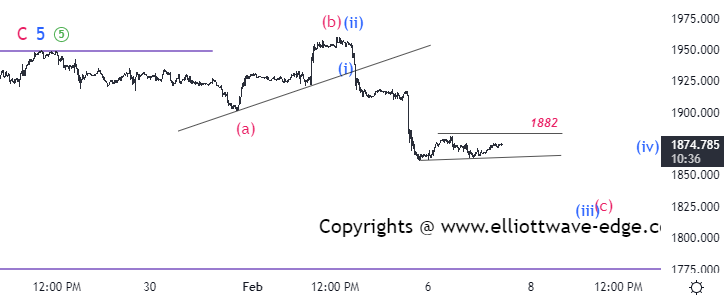
Gold is in a "abc" inverted flat pattern on a 15 min chart . The personality of fall is only happening in the "c" wave so buying at any level is not advisable till close above 1900 on a daily/weekly base.
1882 to 1898 may face resistance and below 1865 for 1849.
S&P500 1H Elliottwave :
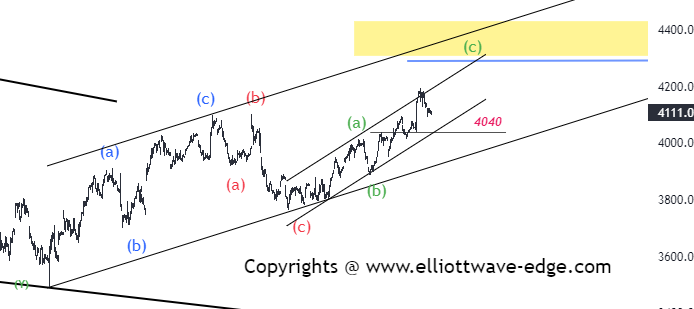
ABC or WXY pattern in a retracement of the prior leg is still in progress. Price staying above 4040 is a bullish momentum intake, below 4040 we will re-count the waves.
Bitcoin 2H Elliottwave :
Fibonacci retracement of Prior wave 23.6-38.2% is @ 22400-21200
If the price comes in this zone with three wave structure then it is a sign of uptrend strength intake.
Below 21200 bears may get active.
Telegram Free Channel: https://t.me/Forex_tradingsignals


.png)


No comments:
Post a Comment