Sunday, 12 February 2023
AUD/NZD Big Picture - Monthly Outlook
AUD/NZD Monthly Elliottwave Chart :
Till we have completed 1st sub-wave of the 5th wave and 2nd wave correction is unfolding . we may see in the coming days trend resumes its downtrend.
Wednesday, 8 February 2023
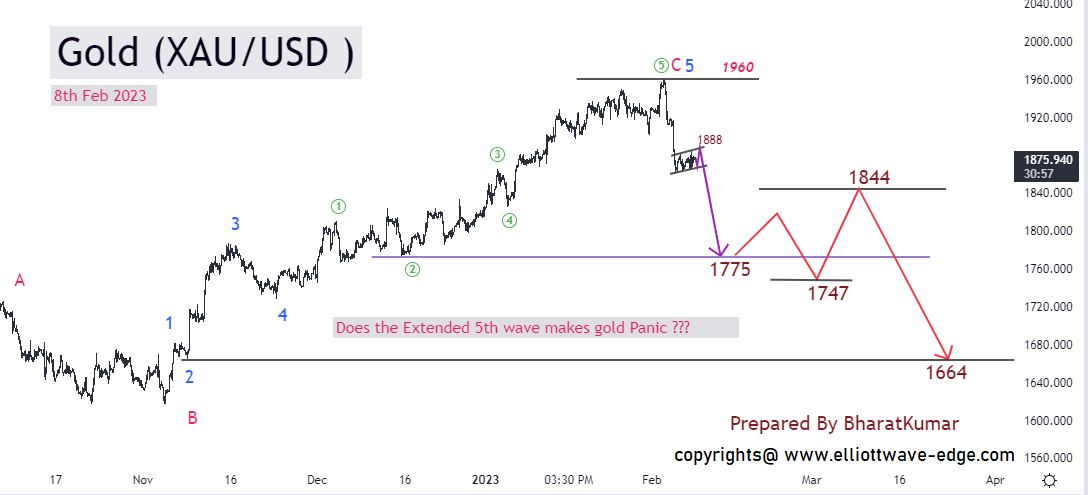
Wave 5 extension in the Gold (XAU/USD) that made traders rich.
Gold Elliott wave proposed Road Map:
In the previous post, said Gold XAU/USD Weekly Outlook 3rd Jan 2023
Bears will get active below 1893 for the Target of 1871/1849 Bulls will get active between 1893-1910 for the Target of 1945
Gold is trading below 1893 and it is heavily in Bear grip. I am giving Propose Road-Map for Gold as below chart.
You can see in the chart 5th wave is extended and it is a Fibonacci 138.2%(0-3)The beauty of the extended 5th wave is after the extended 5th wave price falls rapidly upto the 2nd wave of the 5th wave which comes near 1775
So I am given the target of the fall is up to 1775. then I have forecast inverted flat correction up to 1844 with a low of 1749.
One more leg from 1844 to 1664 will be the final wave. Here levels may vary here and there but I am trying to tell you the psychology of traders once you think the uptrend, will fall, once you are convinced the downtrend, will go up.
FOREX ACCOUNT MANAGEMENT SERVICE:
Tuesday, 7 February 2023
DXY ,Gold, SPX500 and Bitcoin overview for 7th Feb 2023
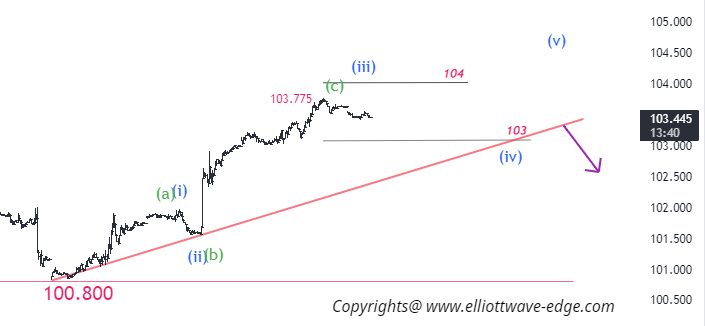
Dollar Index (DXY) Elliott Wave :
let's see the 15 min chart,
Gold Elliott wave Analysis:
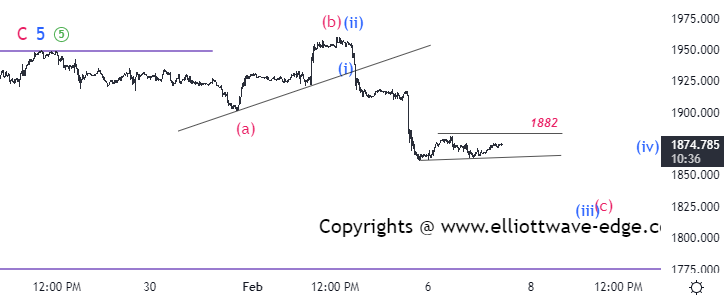
Gold is in a "abc" inverted flat pattern on a 15 min chart . The personality of fall is only happening in the "c" wave so buying at any level is not advisable till close above 1900 on a daily/weekly base.
S&P500 1H Elliottwave :
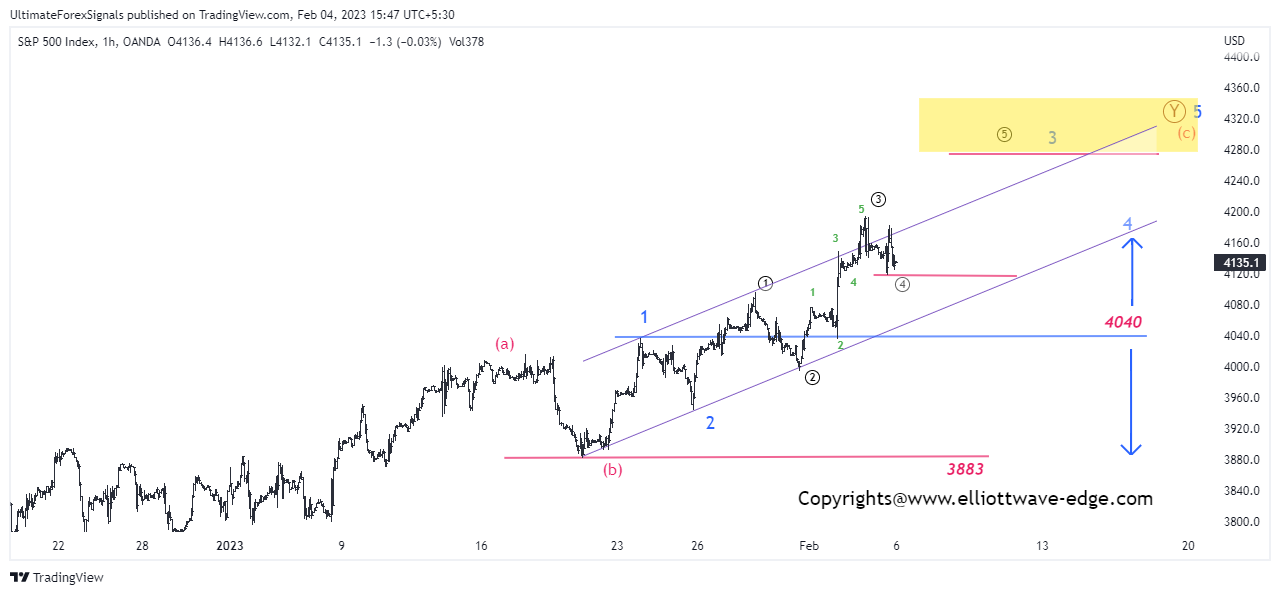
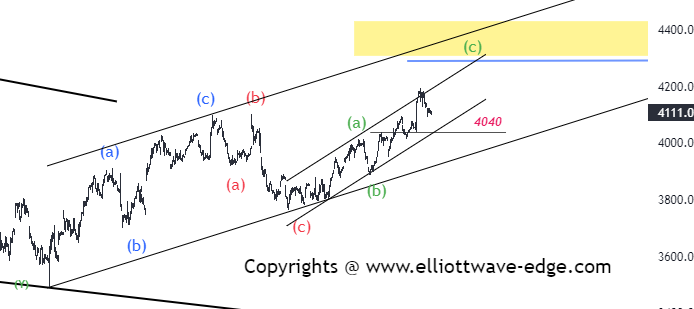
ABC or WXY pattern in a retracement of the prior leg is still in progress. Price staying above 4040 is a bullish momentum intake, below 4040 we will re-count the waves.
Bitcoin 2H Elliottwave :
Monday, 6 February 2023
Nifty50 forecast 2023
Nifty50 Elliottwave Complex Correction :
On Higher Timeframe, Nifty50 is in 4th wave complex correction as shown on chart.
ABC or WXY correction is unfolding. where X or B wave brocken starting of the A wave 18600 level.
Wave 1 and 2 are mentioned on a chart. Wave 2 is 38.2% corrected wave 1. Let's zoom down the impulse wave.
If the price break 18200 then we have to re-count the wave.
Sunday, 5 February 2023
Bitcoin : Impulse or Correction
BTC/USD Elliott wave chart:
As shown in the chart I have labeled Bitcoin waves from the prior low 15450. Wave 2 is deep and simple so I am expecting wave 4 to be shallow and complex.
If the price comes in this area with three wave move then we will consider it as a part of the correction of the prior 3 waves. If we see any five waves down move from 24260 then wave 123 is considered as ABC & it will be a downside impulse & a downtrend may intake.
Saturday, 4 February 2023
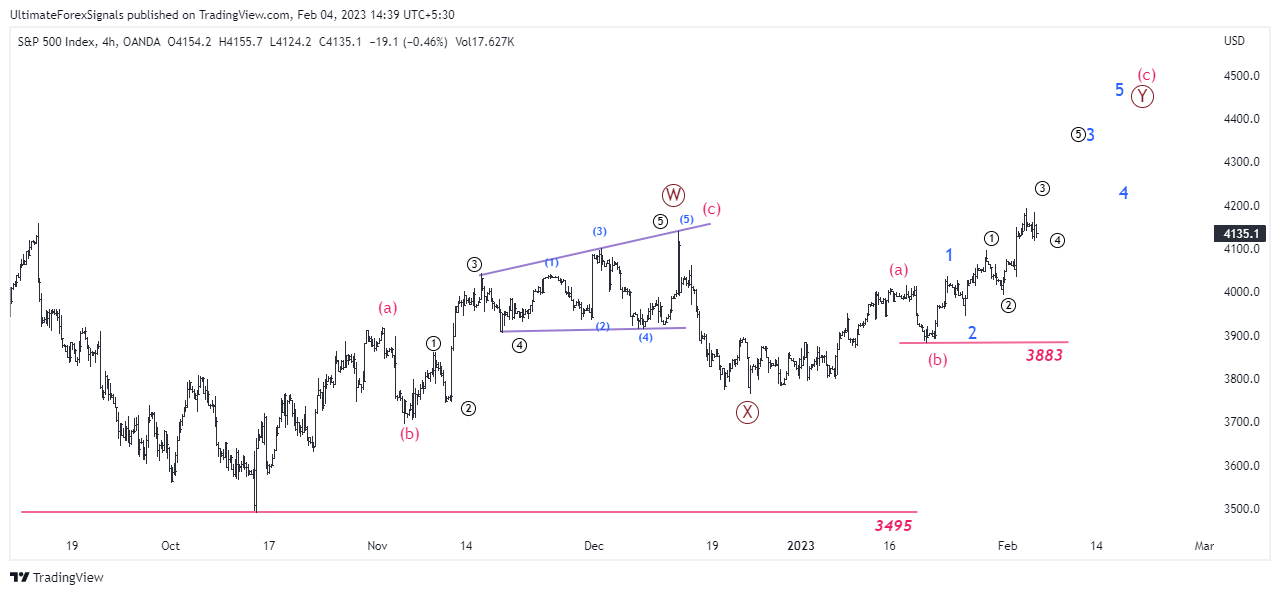
S&P 500 WXY Wave Structure forecast 4th Feb 2023
S&P500 WXY Correction wave analysis :
Prior low 3495 is our starting of the wave counting. See the below Elliott wave 4H chart of the SPX500 Index.
After the completion of five waves, a sharp fall as an "X" wave appeared. Correction of X wave is 61.8%(W)
Conclusion :
Buy momentum is intake above 4040 (1st wave's top) for the Target of 4280.
Andre Agassi: The Challenge
Those interested in tennis may remember former American tennis champion, Andre Agassi. He won eight Grand Slam titles during his career and married German tennis star Steffi Graf after divorcing Hollywood actress Brooke Shields.
In his autobiography, he narrates a very interesting fact about his rivalry with German tennis star Boris Becker. Agassi was beaten by Becker in three straight matches and it was because the way Boris Becker served was almost impossible to resist. Baker's service was coming very fast but it was also difficult to understand where it would go. A big challenge for Agassi was how to solve this problem. For this, he started watching several video cassettes of Boris Becker. He saw these cassettes from not just one but many different angles. After studying it very closely, Agassi noticed a special and distinctive habit of Baker. He noticed that the baker's tongue stuck out every time he served. The funny thing was that every time the direction of the baker's service and the direction of the tongue were the same! Agassi watched many of his videos over and over again. Each time the baker's tongue told him what was going on in his mind and which side he was going to place the service on. In fact, this was happening outside Baker's knowledge, sticking out the tongue was Baker's subconscious habit.
Once Agassi realized this, it was not too difficult for Agassi to break Becker's serve, but Agassi continued to make deliberate mistakes to avoid leaving Boris Becker in doubt as he wanted to hide the fact that he was breaking his opponent's serve. had understood.
Agassi then won the next nine matches in a row. Boris Becker did not realize until the end how this sudden change had come about.
After Boris Baker retired, Agassi told Boris about this fact, and Boris nearly fell off his chair!
Boris said, every time after losing a match with you, I used to tell my wife that I think this man is reading my mind... but I didn't know how!!
Regarding this phenomenon, Agassi writes that however great the competition and how strong the competitor is, we must face it without hesitation. There is a way somewhere but to find that way we need to study intelligently till we find the way. You must be confident that you will win and victory is yours!!!
(From the autobiography 'The Open' by famous tennis player Andre Agassi)
How it is related to trading? Trading is a mass psychology where the crowd is involved and they have a habit of repeating again and again. So we have to read the crowds' subconscious habits by studying the chart. Who decodes the code could be Andre Agassi. Analyzing & Execute the wave is the key to success in trading.
Friday, 3 February 2023
Gold XAU/USD Weekly Outlook 3rd Jan 2023
Gold Weekly Outlook on 3rd Feb 2023:
We have discussed in Gold Price Forecast 2023 : Gold Elliottwave Counting from Y 1833 where we are in the big picture.
From Low 1615 gold is in a Bull structure, If we consider new impulse waves then the chart as below.
Wave III is continuing or it is completed in 1950.
from 1950 I am expecting a triangle or complex correction as shown below where 1910 & 1922 is demand area.
When the price comes in this area, it may bounce towards 1935-1945
If the price trades below 1900 then we may see the following ABC pattern in which C wave is 123.6 to 138.2 of wave A.
Bears will get active below 1893 for the Target of 1871/1849
Thursday, 2 February 2023
AUD/USD extended 5th Wave forecast
AUD/USD Forecast 2023
We start the counting waves from Corona pandemic low in March,2020 at 0.55
Wave (I) is sharp 0.55 to 0.80. As per the Elliott Rules any one of the three impulses is extended.It may possible that wave (I) is extended or it's not.
Wave (II) is 70.7% correction of wave (I). So Wave II is deeper and Zig-Zag correction.
If Wave (I) is extended then Wave (III) may normal. If we consider normal Wave (III) 100% of wave(I) then levels come $0.86. This is the edge for investor & Positional Traders.
If you know how far something is going to go, the game is in your hands.That is the beauty of Elliott wave.
Let's We counting the waves from starting of (III) wave.


Wave 1,2,3,4,5 is sub-waves of Higher degree wave(II).
Wave 2 = Fibonacci 70.7%(1) , Deep and Sharp Zig-Zag Correction.
Wave 3 = 161.8%(1) , Normal wave.
What is normal wave ?
Fibonacci extension is 161.8 or less then 161.8% is consider as normal wave .
Any one of the three waves is most probably extended.Here wave 1 and 3 is normal so wave 5 may extended.
Wave 4 : Exactly Fibonacci 38.2%(3), Inverted flat correction appear as abc
If 4th wave is inverted flat and 3rd wave is normal then there is a high chance to be extended 5th wave. This formula is Money making in trading.
Next You can see on chart 5th of the 5th as green sub-waves is unfolding.
(5th) wave Forecast:
Fibonacci 100%(0-3) @ 0.73050
Fibonacci 123.6%(0-3) @ 0.74760
Fibonacci 138.2%(0-3) @ 0.75760
Fibonacci 161%(0-3) @ 0.77380
All above levels where 5th wave may complete & it may only 1st sub-wave of Higher Degree (III).
So till day we just focus on near target 0.73-0.77 where lower degree wave is going to complete.


-
USD/INR Elliott Wave Analysis: Is a Major Correction to 43 in Sight? The USD/INR pair has been riding a long-term uptrend for decades, reach...
-
XAU/USD GOLD Weekly Elliott wave analysis : Gold Elliott wave analysis on a weekly chart started near the price of $1046. we can see five i...
-
Bitcoin 2024 Analysis : BTC/USD near 57K. WXY correction might completed at 53k. Bitcoin needs to cross 63800 in five sub-waves as suggest...



.png)


