XAU/USD Elliottwave Analysis
Starting from Year 1833
Gold is the oldest currency on the planet. The attraction
of human beings toward gold has been going on for many years. Gold never lacks
trading volume because small investors, retailers, jewelers, hedge funds, and
big banks all trade in this pair. Let’s start the analysis.
Today's date is 29th Jan 2023. Let’s start a
detailed analysis from the Year 1833 low around $20
Y 1833 to Y1930
around this 100 Years price is moves $20 to $21 then sudden sharp move in
between 1930 to 1933 & Price touched to $34.
3rd
wave in any degree is always steep and you can easily identify. So here one
thing is clear that 1930 to 1933 is a 3rd wave.
Again price
range is bound from Y 1933 to Y 1968. Around 65 years price is around $35. Now
you can imagine those who invested in gold from 1933 to 1966 are how
frustrating years for them. It is definitely 4th wave as a frustrated wave
personality.4th wave is most the time-consuming wave to any degree.Elliott
has said one of the three impulses is extended.
Y 1968 to 1979
is extended 5th wave.
Price $35 to
$890
Wow!! what an investment
return in 10 Years.
Now I think you
are clever enough to understand the importance of Technical analysis in
investment also. You can save your time and time is money.
So here Y 1833
to 1978, Five impulse waves were completed & presented on the chart as
Green sub-waves as (i), (ii), (iii), (iv), (v)
These five
sub-waves are called the higher degree 1st wave & I label it on the chart
as wave (1 ).
So
our first higher degree wave (1) from Y 1833 to Y1979 around 146 years &
Price $ 20 to $ 890.
After
five impulses there is a time for correction as in Elliott’s basic 8-wave
pattern.
Now, it is time for ABC Correction.Before
starting ABC correction we understand about Zig-Zag Correction. Zig-Zag is a
5-3-5 Pattern as below.
 In this
pattern, A & C wave has five waves & B wave has three waves or triangle.
C wave has always five waves in any correction. In a Zig-Zag correction “B” wave tends to be well below starting of the A
wave or below 61.8% of A wave.
Let’s jump to
the chart,
Wave (a)(b)(c) is a
correction of sub-waves as (i), (ii), (iii), (iv), (v) where as,
Wave (a) : five
waves
Wave (b) :
three waves
Wave (c) : five
waves complete the 5-3-5 structure.
You can see
wave (b) is well below the starting point of
wave (a).
b wave =
Fibonacci retracement 23.6% (a wave).
C wave is
truncated. It is completed in Y 1999 at $254.
Which is a sign
of the next wave will be powerful.
So
our first higher degree wave (2) from Y1979 to Y 1999 around 20 years &
Price $ 890 to $ 254.
Wave 2 has
shown a 71% price fall. We will consider it a sharp and deep 2nd wave.
Wave
(3): Y1999 to continuing
Have you
noticed the alternation between sub-waves 2 and 4?
Sub-wave 2 is
sharp and shallow whereas subwave 4 is complex and deep.
Subwave 3 is a normal
wave because subwave 3 < 161.8%(Sub-wave 1 )
So as per
Elliott's rules, any one of the three impulses should be extended. It may sub-wave
5th could be extended.
Sub-wave 5th :
Now you can
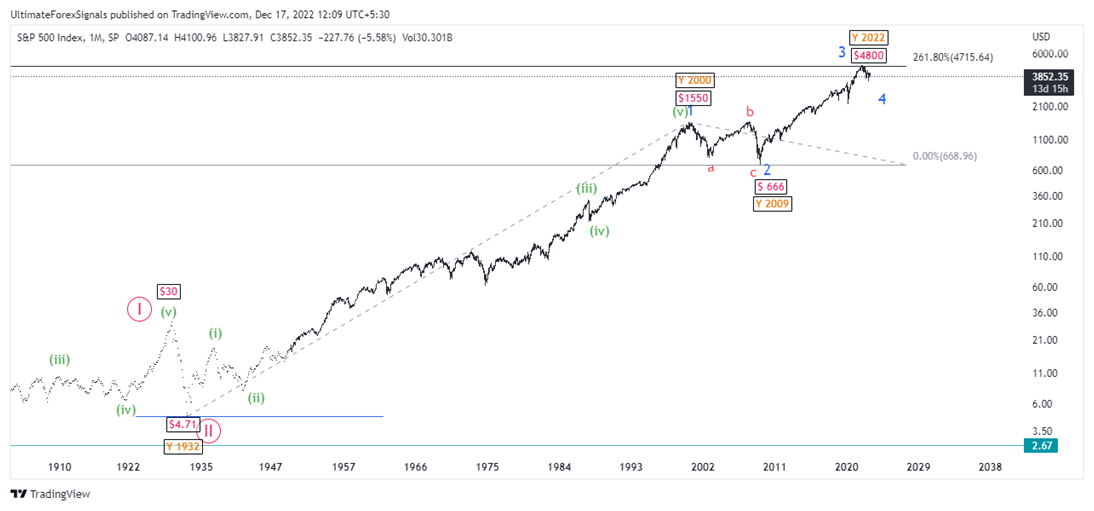
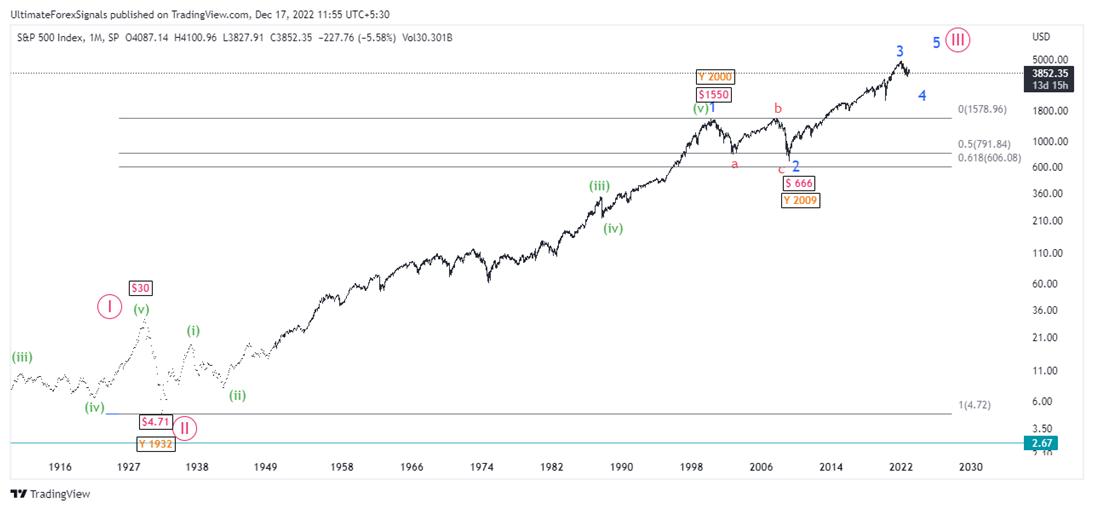
easily identify that we have completed III wave and complex wave IV . Wave III is nearly 261.8% (wave I)
Wave IV seems
completed "abc" correction. It may unfold a triangle or further any
complex pattern. It is very difficult to trade in 4th wave. When we are in 4th
wave then need extra care as it is complex and confusing. Many professionals
also avoid trading in 4th wave or reduce the lot size.
IV wave has abc
flat correction. Flat Correction pattern is ABC (3-3-5) as shown in the figure.
In this
pattern, A & B wave has three waves & C wave has five waves. C wave has
always five waves in any correction. In a flat pattern “B” wave tends to end
near starting of the “A” wave.
C wave is
completed at Low 1615. There is a possibility that the iv wave is completed or
may not. We should analyze the wave that started from the prior low 1615.
From 1615 either abc or new impulse begun. Till we have not confirmed.
If any triangle or complex pattern appear then we will count it as a IV wave. let's see which pattern going to unfold in coming days.
Forex Account Management Service :
Thank You

 As
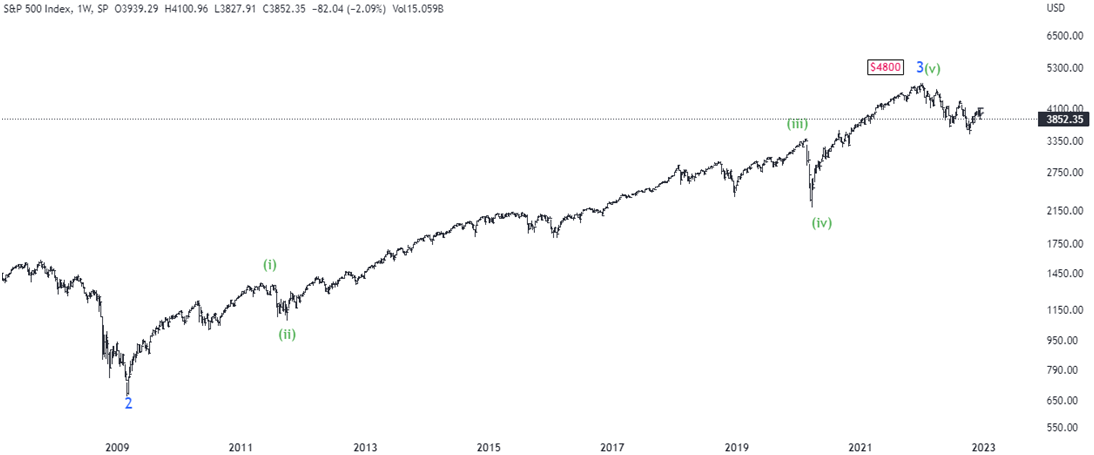
usual 3rd wave personality is easily identified on
the chart in any degree. Here extended Sub-wave 3 is exactly 261.8%
Fibonacci ratio of 1st sub-wave.
  Inside
Sub-wave 3, Mini sub waves as mentioned in green color also dance to Elliott
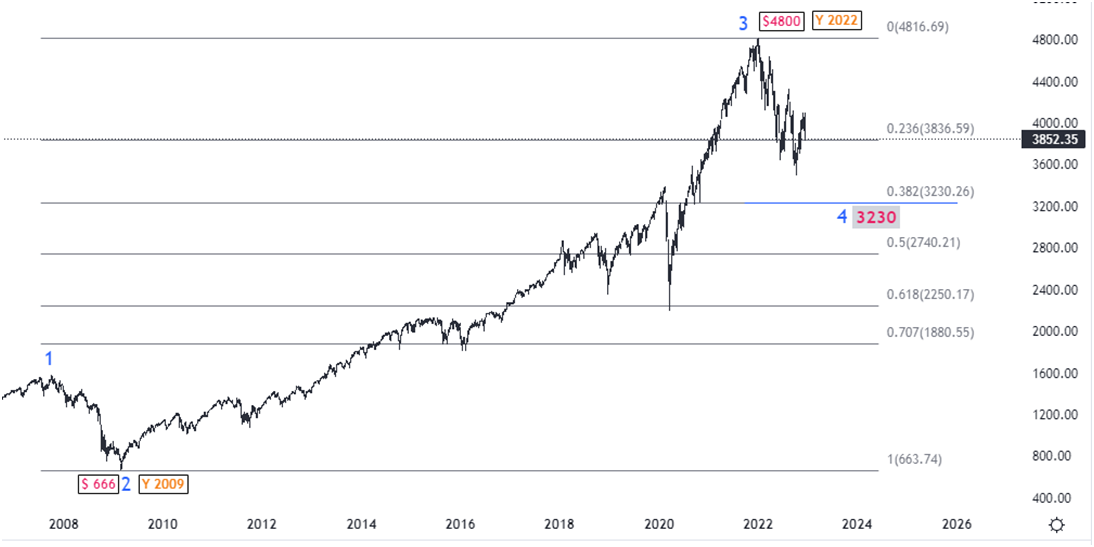
tunes.Sub-wave 4: Y 2022 to Under Progress & Price $4800 to .... ???
 So
we have one level where the end of Sub-wave 4th correction is
$3230Let’s
double-check with the inside of the Sub-wave 4th pattern.
 WXY pattern is showing on chart.
  So
we have one level where the end of Sub-wave 4th correction is
$3230Let’s
double-check with the inside of the Sub-wave 4th pattern.
 WXY pattern is showing on chart.


